The Imperative of Data Observability in the Modern Data Landscape
Executive Summary
Data observability represents a critical evolution in how organizations manage and maintain their most valuable asset: data. It is a comprehensive practice focused on monitoring, managing, and ensuring the quality, availability, and reliability of data across an organization’s entire data ecosystem, encompassing various processes, systems, and pipelines. Its core purpose is to provide a deep, real-time understanding of data health, moving beyond traditional monitoring to proactively identify, troubleshoot, and resolve data issues before they impact business operations.1
The necessity for robust data observability has intensified dramatically in today’s data-driven world. The exponential growth in data volume and complexity, coupled with an increasing reliance on data for critical decision-making and the pervasive adoption of Artificial Intelligence (AI) and Machine Learning (ML) models, has rendered traditional data management approaches insufficient. Data observability ensures the integrity and trustworthiness of data that fuels these transformative technologies, acting as a vital defense against “data downtime” and its associated financial and reputational costs.1
This report delves into the five foundational pillars of data observability—Freshness, Distribution, Volume, Schema, and Lineage—which collectively provide a holistic framework for assessing data health. It distinguishes data observability from data quality, illustrating how the former extends and enhances the latter by focusing on systemic issues within data pipelines rather than just individual data errors. Furthermore, the report explores key practical applications, highlights leading commercial and open-source solutions, and presents real-world examples of its adoption across diverse industries. Finally, it examines the significant pitfalls of neglecting data observability and discusses future trends, including the increasing role of AI-driven automation and deeper integration with DataOps and DataSecOps practices. The analysis concludes that data observability is no longer a mere operational enhancement but a strategic imperative for any organization aiming to build data trust and achieve sustained business agility.
1. Understanding Data Observability
1.1. Definition and Core Principles
Data observability is defined as the holistic practice of continuously monitoring, actively managing, and meticulously maintaining the health, quality, availability, and reliability of data as it flows through an organization’s intricate network of processes, systems, and pipelines.1 It aims to cultivate a profound understanding of the data’s current state and overall well-being across the entire data ecosystem.1 This discipline extends far beyond conventional data monitoring, which typically provides only a surface-level indication of a problem. Instead, data observability is designed to facilitate the rapid identification, precise troubleshooting, and near real-time resolution of data-related issues.1 In essence, it functions as a comprehensive quality control mechanism for the modern data stack, ensuring the integrity and trustworthiness of data from its source to its ultimate consumption.2
The overarching objective of data observability is to detect data anomalies and inconsistencies at their earliest stages, comprehend their underlying root causes, and implement effective resolutions before these issues can undermine trust in data, lead to costly “data downtime,” or trigger cascading operational disruptions and financial losses.2 This proactive stance is underpinned by several core principles:
- Holistic View: Data observability establishes a comprehensive “radar system” that meticulously tracks every data point’s journey, from its initial source through various transformations to its final utilization in reports, applications, and models.3 This end-to-end visibility is crucial for understanding interconnected dependencies.
- Proactive vs. Reactive: A fundamental characteristic of data observability is its shift from reactive problem-solving to proactive prevention. Unlike traditional monitoring, which often responds to issues after they have already occurred, data observability focuses on identifying and mitigating potential problems before they can impact downstream dependencies or critical business outcomes.1 This anticipatory approach significantly reduces the severity and cost of data incidents.
- Real-time Insights: The capability to provide real-time insights is central to data observability. It enables the swift identification of errors and deviations in data through sophisticated anomaly detection algorithms and immediate alerting mechanisms.1 This immediacy is vital for maintaining operational continuity in fast-paced data environments.
- Trust and Reliability: A primary objective is to ensure that data remains a valuable and trustworthy asset rather than becoming a potential liability. By guaranteeing the quality and reliability of data, observability fosters confidence in data-driven decision-making and supports the effective deployment of advanced AI and ML models.1
- End-to-End Coverage: For maximum effectiveness, data observability must be consistently integrated throughout the entire data lifecycle. This involves standardizing and centralizing data management activities across various teams, providing a clear and uninterrupted view of issues and their organizational impacts.1
The conceptual difference between “monitoring” and “observability” is a critical point of understanding. Monitoring typically answers the question if something is broken (e.g., “Is the data pipeline running?”). In contrast, observability provides the deeper context required to understand why it broke, what the precise impact is, and how to prevent similar issues in the future. This represents a fundamental shift in data management, moving from merely observing symptoms to understanding the underlying health and behavior of complex data systems. This deeper level of introspection and predictive capability, driven by more comprehensive data collection and analysis, is crucial for navigating the complexities of modern, distributed data environments where traditional monitoring’s limited insights are often insufficient. This evolution enables organizations to transition from a reactive incident response posture to a more proactive incident prevention strategy, thereby significantly reducing data downtime and its associated financial and operational burdens.
1.2. The Evolution of Data Observability: A Historical Perspective
The journey of data observability is not an isolated development but rather an evolution rooted in the broader field of software observability. Its foundational concepts emerged from practices in application performance monitoring (APM) and infrastructure monitoring. Initially, the focus was on monitoring data platforms in a manner analogous to server monitoring, providing alerts for system failures and general health metrics.8
Approximately five years ago, data observability began to emerge as a distinct discipline, often hailed as the “missing puzzle piece” in the burgeoning modern data stack.8 The initial wave of data observability platforms was largely reactive and primarily designed for data engineers, with a focus on automating and scaling data quality checks. These early tools were adept at detecting technical anomalies such as schema drift, freshness issues, and volume deviations, effectively transforming manual testing into more programmatic and scalable processes.8 However, a significant limitation of this first generation was its tendency to generate “shallow alerts without context.” These alerts often failed to provide critical information regarding who was impacted or the business criticality of the data, treating data incidents merely as infrastructure outages. This highlighted a crucial realization: data is more than just infrastructure; it is a vital business product, and its quality extends beyond mere uptime to encompass trust, usability, and direct business impact.8
Following this, the “shift-left” movement gained traction, drawing further inspiration from DevOps methodologies. This approach advocated embedding data quality checks and observability practices earlier in the data lifecycle, such as during data transformation (dbt) runs, Continuous Integration/Continuous Deployment (CI/CD) pipelines, or through the implementation of data contracts. While effective for technical users and for catching issues early in the development workflow, this approach often narrowed the scope of observability to technical problems, failing to provide the broader business context needed by non-technical users, such as a marketing analyst trying to interpret a dashboard anomaly or a product leader assessing a KPI drop.8 This reinforced the perception that data quality was solely a developer’s concern, rather than a company-wide imperative.
In parallel, many platforms began to integrate data lineage, discovery, and metadata management capabilities. The underlying premise was to provide richer context: not just what broke, but why it broke and where in the data flow the issue originated. This convergence led to an increasing overlap between data observability and data cataloging tools, sometimes causing confusion among customers regarding their distinct functionalities. Often, this convergence prioritized breadth of features over depth of actionable insights, failing to effectively translate technical metadata into meaningful business context.8
The broader evolution of observability, which data observability leverages, also progressed significantly. It began with rudimentary log management primarily used for debugging, then advanced to the use of metrics and Application Performance Monitoring (APM) tools that enabled more structured and proactive monitoring of system performance. Today, this evolution has culminated in highly sophisticated, AI-driven analytics systems that provide predictive and proactive observability.9 Data observability, in its current state, is recognized as the natural evolution of the data quality movement, serving as a foundational enabler for the practice of DataOps. It is increasingly viewed as the critical intersection of technical data reliability and tangible business impact, capable of connecting a broken data table directly to a compromised executive dashboard.1
This historical progression illustrates a continuous refinement in data management, moving from purely technical monitoring to a more holistic, business-aware discipline. Early solutions, despite their technical merits, were often insufficient because they struggled to answer fundamental business questions such as “who was impacted?” or “how critical was the data?”.8 Modern data observability strives to bridge this crucial gap, demonstrating its value in terms of protecting revenue, enhancing customer trust, and enabling strategic decision-making. This maturation underscores that data teams are increasingly expected to function as strategic business partners, not merely as technical custodians. Consequently, the tools and practices of data observability must continue to evolve to provide insights that are directly relevant to business outcomes, fostering deeper collaboration between data professionals and business stakeholders across the organization.
1.3. Why Data Observability is Essential in Today’s Data-Driven World
The contemporary business landscape is characterized by an unprecedented reliance on data, making data observability not merely beneficial but absolutely essential. Several converging factors underscore its critical importance at this juncture.
Firstly, the sheer explosion of data complexity and volume presents an overwhelming challenge. Businesses are generating escalating volumes of data from an ever-growing array of diverse sources, leading to increasing complexities in data operations, particularly across hybrid and multi-cloud environments.4 This scale and fragmentation render traditional, manual data quality checks and reactive troubleshooting approaches impractical and prohibitively costly. The modern data environment necessitates sophisticated, automated monitoring tools capable of swiftly detecting and rectifying data anomalies across vast and intricate pipelines.4
Secondly, the pervasive reliance on data-driven decision-making means that the integrity of data directly impacts an organization’s strategic agility and competitive edge. Enterprises increasingly depend on accurate, timely, and reliable data to gain actionable insights, inform strategic planning, develop advanced machine learning models, and drive innovation.1 In such an environment, poor data quality can swiftly transform data from a valuable asset into a significant liability, leading to misguided strategies, missed opportunities, and failed initiatives.1
Thirdly, the rise of Artificial Intelligence (AI) and Machine Learning (ML) models has profoundly reshaped how teams consume and act on data. The effectiveness and trustworthiness of these advanced models are inextricably linked to the quality and reliability of their input data. Data observability is therefore crucial for ensuring “AI-ready” data, continuously monitoring model performance, and providing transparency into the rationale behind AI predictions.3 Without robust observability, AI models can become “black boxes,” making it difficult to diagnose issues, understand biases, or ensure responsible deployment.3 Data observability acts as a foundational layer, ensuring the integrity and trustworthiness of the data that fuels these transformative technologies. Organizations investing heavily in AI and digital initiatives must prioritize data observability; it is not an optional add-on but a critical enabler for deriving value and mitigating risks from these investments. This also implies a growing demand for observability solutions specifically tailored to AI/ML workflows, including monitoring for data drift and model performance.
Fourthly, data observability serves as the best defense against data downtime and a crucial enabler for meeting Service Level Agreements (SLAs). It continuously monitors data pipelines to ensure the complete, accurate, and timely delivery of data, thereby preventing disruptions that can cascade into significant revenue loss, operational chaos, and damaged customer trust.1 By proactively detecting issues, organizations can minimize the severe financial and reputational impacts associated with unreliable data.
Finally, the tangible operational benefits further solidify its necessity. These include significantly higher data quality, achieved by detecting issues such as missing values, duplicate records, or inconsistent formats early in the pipeline.1 It enables faster troubleshooting through anomaly detection and real-time alerts, which minimizes the cost and severity of downtime.1 Data observability also fosters improved collaboration among data teams and business stakeholders through shared visibility into critical datasets, and increases overall efficiency by pinpointing bottlenecks and optimizing resource usage.1 Furthermore, it enhances compliance by ensuring data meets necessary standards for accuracy and security in regulated industries, and ultimately contributes to increased revenue by unlocking new insights and identifying trends from trustworthy data assets.1 The global data observability market is experiencing significant growth, projected to reach USD 7.01 billion by 2033 from USD 2.3 billion in 2023, growing at a Compound Annual Growth Rate (CAGR) of 11.8%.4 North America currently leads this market, benefiting from a highly developed IT infrastructure and substantial investments in digital transformation.4 These market trends are not just statistics but powerful indicators of a widespread industry recognition that traditional data management approaches are no longer sufficient to manage the escalating risks and unlock the full potential of data in modern, AI-driven enterprises.
2. The Five Pillars of Data Observability
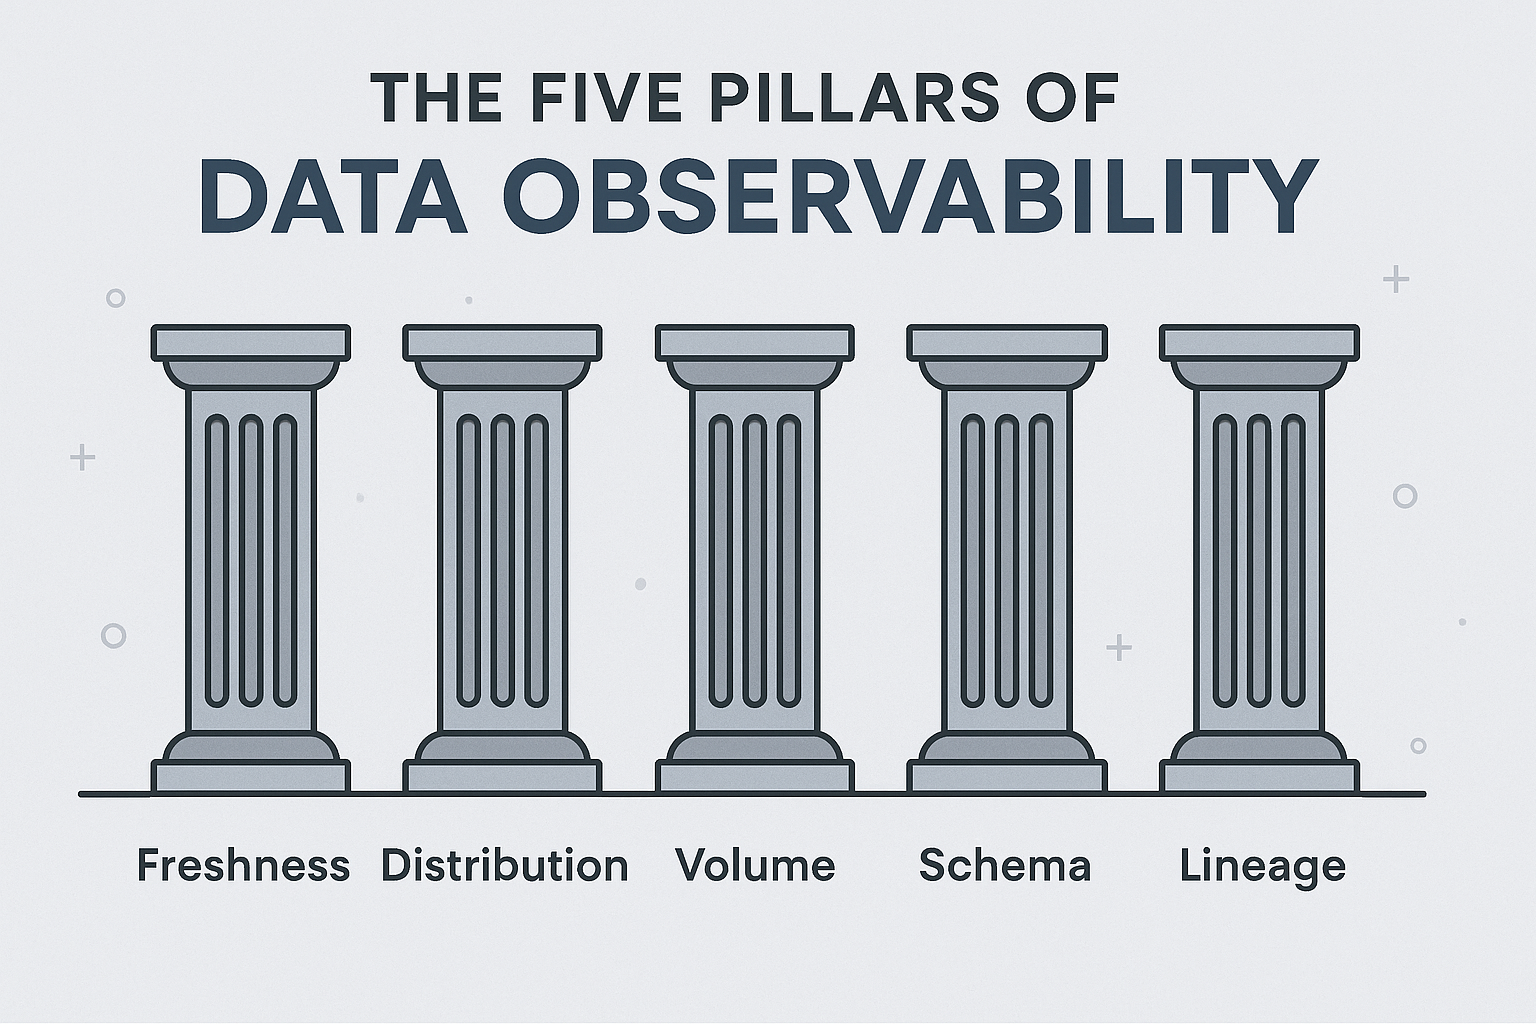
The five pillars of data observability establish a comprehensive and widely recognized framework for understanding and ensuring the health, quality, and reliability of data throughout its entire lifecycle.1 It is important to note that while some discussions in the broader observability domain refer to “four pillars” (Metrics, Metadata, Lineage, Logs) as fundamental
dimensions or types of telemetry that enable observability 2, the “five pillars” of Freshness, Distribution, Volume, Schema, and Lineage are predominantly adopted specifically within the context of
data observability to describe what distinct aspects of data health are being monitored and assessed.2 These five technical pillars provide the critical information that indicates “what’s broken” in an organization’s data assets.2
The existence of these two common categorizations—the five technical, data-centric pillars and the four foundational, telemetry-centric dimensions—highlights the multi-faceted nature of observability. The five pillars (Freshness, Distribution, Volume, Schema, Lineage) describe the observable characteristics or attributes of the data itself that directly indicate its quality and operational health. In contrast, the four pillars (Metrics, Metadata, Lineage, Logs) describe the types of data or telemetry signals that are collected and analyzed to enable the assessment of those five data characteristics. This distinction is crucial for a nuanced understanding of how data observability is implemented and what specific aspects it measures to provide a holistic view of data health. The true power of data observability lies not in monitoring each pillar in isolation, but in their synergistic application. For instance, a schema change (Schema) can lead to a drop in the number of rows (Volume), which then affects the expected values (Distribution) and makes the data stale (Freshness), with the full impact understood through Lineage. A comprehensive observability solution therefore integrates insights from all pillars to provide a holistic and actionable view of data health.
2.1. Freshness: Timeliness of Data
Freshness quantifies how current and up-to-date data is, along with the frequency with which it is updated.1 This pillar directly addresses the recency of data and is crucial for identifying any significant gaps in time during which data has not been updated.1 Often, a primary culprit behind broken data pipelines is a freshness issue, indicating a halt or delay in data flow.1 This pillar helps answer critical questions for data consumers, such as: “Did this dataset arrive on time?” and “Is it being updated as frequently as needed to meet business requirements?”.1
The importance of data freshness is paramount, especially for teams that rely on real-time or near-real-time data to make time-sensitive decisions, such as in financial trading, fraud detection, or dynamic pricing models.14 A lack of data freshness can lead to reliance on obsolete or outdated insights, which directly impacts business outcomes and can result in significant operational consequences due to lag-induced errors.5 For example, a sudden, large gap in time where a periodically updated table shows no new updates clearly indicates a freshness issue that requires immediate attention.13 Monitoring timestamps and source updates is therefore essential to ensure timely data delivery and prevent such critical delays.5 Freshness is more than just a metric for data timeliness; it serves as a direct and immediate indicator of the operational health of data pipelines. A breakdown in freshness can cascade into significant business impacts, particularly for time-sensitive operations. Proactive alerts on freshness issues allow for early intervention, preventing downstream failures that could compromise critical business processes and lead to substantial financial or reputational damage.
2.2. Distribution: Data Field Health and Patterns
Distribution refers to the assessment of whether data values within individual fields or columns fall within an expected and accepted range or pattern.1 It serves as a key indicator of the field-level health of data assets, providing granular insights into the quality of the data content itself.1
Deviations from the expected distribution can be strong signals of underlying data quality issues, errors, or unexpected changes in the source data.1 Examples include a sudden and significant spike in null values for a particular field, an abnormal representation of expected categorical values, or numerical values falling outside predefined acceptable ranges.13 This pillar also involves checking if data values conform to the expected form and length.1 Monitoring data distribution is crucial for detecting subtle changes in data quality that might not be severe enough to trigger more obvious schema or volume alerts, but could still compromise the integrity or reliability of downstream analytics or AI models.2 Regular distribution checks are vital for guaranteeing that data remains consistent and trustworthy over time, ensuring its veracity.14 Distribution monitoring moves beyond simple “existence” or “timeliness” checks to assess the
quality and validity of the data content itself. This capability is particularly crucial for detecting “silent failures”—scenarios where data is present and on time, but is fundamentally incorrect, biased, or misleading in its values. Such issues, if undetected, can lead to deeply flawed insights, erroneous AI model behavior, and misguided business decisions without any immediate or obvious operational signs of a problem.
2.3. Volume: Completeness and Quantity of Data
Volume refers to the total amount of data being generated, ingested, transformed, and moved through various processes and pipelines within the data ecosystem.1 It also serves as a direct and critical measure of the completeness of data tables, indicating whether all expected records are present.1
This pillar is a primary indicator of whether the data intake is meeting expected thresholds.1 Sudden and unexpected drops or spikes in data volume are strong signals of anomalies, potential data loss, or bottlenecks within the data pipeline.13 For instance, if a dataset that typically contains 200 million rows suddenly reduces to 5 million, it represents a clear volume anomaly that demands immediate attention.13 This pillar helps answer the fundamental question: “Is the expected volume of data available in this dataset?”.1 Monitoring data volume is critical for detecting partial or complete data loss events, which can have severe downstream consequences.12 Inconsistent data volume patterns are often indicative of underlying issues with the data sources themselves or the ingestion processes, making it a vital early warning system.19 Volume monitoring functions as a fundamental “canary in the coal mine” for data pipelines. Abrupt or unexpected deviations in data volume frequently point to upstream failures, broken Extract, Transform, Load (ETL) processes, or misconfigurations that can lead to incomplete datasets. This directly impacts the reliability and accuracy of any analytics, reports, or machine learning models built upon that data, making it a critical early warning system for broader data integrity issues and operational disruptions.
2.4. Schema: Data Structure and Organization
Schema describes the underlying organization and formal structure of data, as typically supported by a database management system.1 This includes definitions of columns, data types, relationships between tables, and overall data architecture.
Changes in schema, such as fields being added, removed, or modified, or tables being removed or improperly loaded, frequently result in broken data and cascading errors throughout the data ecosystem.1 Data observability plays a crucial role in ensuring that data is organized consistently, remains compatible across different systems, and maintains its structural integrity throughout its lifecycle.1 Auditing schema changes is a key component of this pillar, providing a robust way to monitor the health of data as part of the data observability framework.13 Unexpected schema changes can lead to severe disruptions, breaking data pipelines and causing errors to surface in downstream reports and applications.13 Robust observability into schema changes enables data teams to proactively align transformations with existing processes, thereby preventing compatibility issues and system failures before they impact end-users.5 Schema changes, while often seemingly minor technical adjustments, are a pervasive and frequently overlooked cause of significant data downtime and quality degradation. Without robust schema observability, even subtle structural alterations can silently propagate errors throughout complex, interconnected data ecosystems, leading to widespread data quality issues, broken dashboards, and erroneous analytical outputs. This highlights the critical need for a proactive and automated approach to managing schema evolution, treating data structure as a dynamic and critical asset that requires continuous monitoring and validation.
2.5. Lineage: Data’s Journey and Dependencies
Lineage provides a comprehensive map of how data flows through an organization, tracing its journey from raw sources, through various transformations and processes, to its final consumption in dashboards, machine learning models, and business applications.1 Its primary purpose is to answer the crucial question, “Where did the data break?” when an issue arises, providing a clear path for investigation.1
Lineage reveals not only the origin of data but also precisely identifies what downstream systems or reports are impacted when a data failure occurs, illustrating the “blast radius” of a problem.2 It meticulously records any changes to the data, including
what changed, why it changed, and how it changed along the way.1 Data lineage is most often represented visually for clarity and ease of understanding, making complex data flows digestible.1 This pillar is absolutely crucial for understanding complex data dependencies and predicting the “ripple effects” that any changes or issues in upstream data will have on downstream consumers.16 It plays a vital role in efficient root cause analysis, enabling data teams to pinpoint the exact origin of errors and quickly inform impacted systems about an issue.12 For example, if a marketing campaign’s performance dashboard shows incorrect numbers, lineage can trace back to a late or erroneous upstream table, showing the exact source of the problem and its impact.2 Furthermore, robust lineage capabilities enable faster troubleshooting, smarter change management by anticipating downstream impacts, and streamlined compliance and audit readiness by demonstrating data handling processes.20 Lineage is the critical connective tissue of data observability, providing the indispensable context needed for effective root cause analysis and comprehensive impact assessment in complex data ecosystems. Without robust data lineage, identifying the source of a data issue in a sprawling, interconnected pipeline becomes an arduous “needle in a haystack” problem, leading to prolonged data downtime and a severe erosion of trust in data assets. Its importance extends significantly beyond mere technical debugging, encompassing crucial aspects of business understanding, regulatory compliance, and foundational preparedness for advanced AI/ML initiatives.
Table 1: The Five Pillars of Data Observability
| Pillar | Definition | Key Indicators/Questions Addressed | Importance/Why it Matters |
| Freshness | How up-to-date data is and its update frequency. | Is data current? Are there gaps in updates? Did the dataset arrive on time? 1 | Critical for real-time decision-making; prevents obsolete insights and operational consequences from stale data.5 |
| Distribution | Whether data values fall within an expected range or pattern at the field level. | Are values within an accepted range? Is the null rate as expected? Are values in expected form/length? 1 | Detects subtle data quality issues that may compromise analytics/AI models; ensures data consistency over time.2 |
| Volume | The amount of data flowing through pipelines, indicating completeness. | Is data intake meeting thresholds? Any unexpected drops/spikes? Is the dataset complete? 1 | Key indicator of data loss or pipeline bottlenecks; signals issues with data sources or ingestion processes.12 |
| Schema | The organization and structure of data, including definitions and relationships. | Has the schema changed (fields added/removed/changed)? Are tables loaded properly? 1 | Prevents broken data pipelines and errors in downstream reports due to structural changes; ensures data compatibility.1 |
| Lineage | The end-to-end journey of data from source to consumption, noting transformations. | Where did data come from? What systems does it affect? What changed, why, and how? 1 | Crucial for root cause analysis, impact assessment, and understanding data dependencies; aids compliance and change management.12 |
3. Data Observability vs. Data Quality: A Critical Distinction
While often used interchangeably, data observability and data quality are distinct yet highly complementary disciplines. Understanding their differences and synergistic relationship is fundamental to effective data management in modern enterprises.
3.1. Defining Data Quality and its Dimensions
Data quality fundamentally refers to the inherent characteristics of data that determine its fitness for use. It assesses the accuracy, completeness, consistency, and timeliness of data.1 Data quality primarily focuses on the intrinsic characteristics and static state of the data itself.3
Organizations typically assess data quality across several distinct dimensions:
- Accuracy: This dimension measures the degree to which data is free from errors and precisely reflects the real-world entities or events it is intended to represent.7
- Completeness: This evaluates whether all expected and critical fields are fully entered and present, indicating no missing data points essential for analysis or operations.7
- Consistency: This determines if similar data points, when accessed from different sources or at different times, agree with each other, ensuring invariability over time and across systems.7 Inconsistent data often indicates inaccuracies in one or more datasets.19
- Timeliness: This assesses how current the data is and whether data processing and delivery occur within the required timeframes to remain relevant for decision-making. More recent data tends to be more accurate and relevant.19
- Validity/Conformity: This checks if the data adheres to predefined values, formats, or business rules, ensuring it conforms to established standards.23
- Uniqueness: This ensures the absence of duplicate records within a dataset, preventing redundancy and skewed analysis.1
The impact of poor data quality on an organization can be substantial, leading to significant financial and operational costs. Data that is inaccurate, incomplete, inconsistent, or untimely can cost organizations between 10% and 30% of their revenues, according to DAMA International estimates.19 Such compromised data leads to unreliable information being used for critical decision-making, results in operational disruptions, and introduces significant compliance risks.11 Data quality, while foundational and absolutely necessary, is inherently reactive and often static in its traditional implementation. Its focus on “data at rest” 19 means it primarily assesses the state of data after it has been processed, often through manual or rule-based checks. This creates a dependency on human intervention for problem identification and resolution, which is often unsustainable and inefficient in today’s dynamic, high-volume data environments.
3.2. How Observability Extends and Enhances Data Quality
While data quality focuses on the intrinsic characteristics of data, data observability broadens the scope significantly to offer comprehensive insights into the operational health of both data and the systems that process it, including AI systems.3 Data observability is fundamentally concerned with the
system that delivers the data, rather than just the data itself.19
The distinction between the two disciplines can be highlighted through several key aspects:
- Proactive vs. Reactive: Data observability embodies a proactive approach to data management.1 It goes beyond merely describing a data-related problem; its aim is to actively resolve the problem and, crucially, prevent its recurrence in the future.19 It functions as a continuous monitoring system, providing real-time visibility into data health.3
- Data in Motion vs. Data at Rest: Traditional data quality typically examines data at rest within datasets.19 In contrast, data observability addresses data in motion, focusing on its health and integrity as it moves through complex data pipelines.19
- Systemic vs. Individual Issues: Data quality often concentrates on correcting individual data errors.19 Data observability, however, aims to identify and fix systemic problems within the entire data delivery system, addressing the root causes of issues rather than just their symptoms.19
- Adaptive Rules vs. Static Rules: Data observability leverages advanced techniques, including machine learning, to generate adaptive rules and metrics that evolve with changing data patterns.19 This stands in contrast to traditional data quality approaches that often rely on static, predefined rules.19
- Root Cause Analysis: Data quality typically deals with the results or manifestations of data issues.19 Data observability, conversely, delves deeper to identify and address the
root causes of those issues, enabling teams to swiftly pinpoint errors and their origins.1
Data observability transforms data quality from a static, post-mortem assessment into a dynamic, real-time, and predictive discipline. By shifting the focus to the system and data in motion, it enables organizations to move from simply identifying bad data to understanding why data becomes bad and preventing these issues at their source. This fundamental shift is essential for scaling data operations, maintaining trust, and ensuring the reliability of data in today’s increasingly complex and distributed data landscapes.
3.3. The Synergy for Data Trustworthiness
Despite their distinctions, data quality and data observability are not mutually exclusive; rather, they operate in powerful synergy towards the shared objective of ensuring more useful and reliable data.19 Their combined application creates a robust framework for data trustworthiness.
Data observability significantly enhances data quality over the long term by identifying and addressing big-picture problems within data pipelines.19 When data pipelines are more reliable and consistently monitored through observability practices, cleaner data is ingested, and fewer errors are introduced into the system. The result is consistently higher quality data and reduced downtime due to data-related issues.19 This relationship can be viewed as combining the reactive defenses of traditional data quality monitoring with the proactive error reduction measures inherent in data observability.19
Furthermore, data observability is recognized as an indispensable companion to data quality in the pursuit of AI readiness.3 While data quality focuses on the intrinsic characteristics of data (e.g., accuracy, completeness), data observability broadens the scope by offering continuous insights into the operational health of both the data itself and the AI systems that consume it.3 This integrated approach is fundamental for building “trustworthy AI” 3 and enabling organizations to truly become data-driven. The relationship is not one of replacement, but of necessary integration: data quality defines the desired state of data, while data observability provides the means to continuously achieve, verify, and maintain that state across dynamic data environments. This integrated approach is fundamental for building confidence in AI outputs and fostering truly data-driven organizational cultures.
Table 2: Data Observability vs. Data Quality: A Comparative View
| Aspect | Data Quality | Data Observability |
| Primary Focus | Intrinsic characteristics of data (accuracy, completeness, consistency, timeliness) 19 | Operational health of data systems and pipelines 1 |
| Scope | Data itself (data at rest in datasets) 19 | The entire data delivery system (data in motion through pipelines) 19 |
| Approach | Reactive (describes problems, corrects individual errors) 19 | Proactive (detects, diagnoses, resolves, and prevents issues) 1 |
| Problem Type | Correcting individual data errors 19 | Fixing systemic problems within the data delivery system 19 |
| Rule Generation | Utilizes static, predefined rules and metrics 19 | Uses machine learning to generate adaptive rules and metrics 19 |
| Problem Stage | Deals with the results of data issues 19 | Deals with the root causes of data issues 19 |
| Goal | Ensure more accurate, reliable, and usable data 19 | Ensure the reliability and usefulness of the entire data collection and delivery system 19 |
4. Practical Applications: Key Use Cases for Data Observability
Data observability offers a wide array of practical applications across various organizational functions, extending its value far beyond mere technical monitoring. Its capabilities translate directly into tangible business benefits, addressing critical challenges in modern data ecosystems.
4.1. Ensuring AI/ML Model Reliability and Performance
The integrity and effectiveness of Artificial Intelligence (AI) and Machine Learning (ML) models are directly contingent upon the quality and consistency of their input data. Data observability acts as a crucial guardian for AI, moving beyond simply monitoring model outputs to ensuring the trustworthiness of the data feeding the models.3 It provides continuous, real-time visibility into the performance of data pipelines and the overall efficacy of AI models.3
Through its capabilities, data observability helps promptly identify anomalies in input features, investigate their root causes, and rectify issues before they can significantly impact AI model performance.3 For instance, if an AI model tasked with predicting customer churn rates begins to generate unexpected results, data observability techniques can trace the lineage of input features, identify influential factors or biases, and elucidate the rationale behind the model’s predictions.3 This transparency is vital for maintaining model performance, preventing biased outcomes, and building trust in AI-driven decisions, especially as AI adoption accelerates. Furthermore, by scrutinizing the data flow and transformations within a model’s pipeline, organizations can identify inefficiencies or bottlenecks and fine-tune data preprocessing steps or adjust model parameters to enhance the model’s predictive accuracy and efficacy.3 It is also essential for identifying data drift—changes in input data characteristics over time—which can significantly degrade ML model performance.24
4.2. Proactive Anomaly Detection and Faster Root Cause Analysis
One of the most immediate and impactful benefits of data observability is its ability to facilitate proactive anomaly detection and significantly accelerate root cause analysis. It enables the swift identification of errors or deviations in data through sophisticated anomaly detection algorithms, real-time monitoring, and automated alerts.1 This capability allows teams to quickly pinpoint the source of problems, whether they stem from data drift, unexpected schema changes, or anomalies in input features.3
The lineage pillar, in particular, is crucial for effective root cause analysis.12 It provides a clear map of data flow, showing exactly where errors originate and what systems are impacted, thereby reducing the time spent on guesswork.20 This rapid identification and resolution of issues significantly minimizes the cost and severity of data-related downtime.1 For example, quick identification and correction of data issues prevent errors from reaching end-users, enhancing customer trust and satisfaction.23 This shift from reactive troubleshooting to proactive anomaly detection and rapid root cause analysis is a core value proposition of data observability. This capability significantly reduces Mean Time To Resolution (MTTR) for data incidents, which translates directly into reduced financial losses and improved operational continuity. The ability to “predict where future issues might emerge” based on usage patterns and historical failures 2 signifies a move towards truly preventive data management.
4.3. Optimizing Data Pipelines and Infrastructure Efficiency
Data observability extends its utility beyond data quality to encompass the operational efficiency and health of the entire data infrastructure. It provides crucial visibility into the performance and availability of data pipelines, as well as the underlying infrastructure components such as servers, storage, and networks.3
Observability tools help pinpoint bottlenecks and performance issues within data workflows, enabling engineers to optimize their systems for better resource usage and quicker processing times.1 Continuous monitoring of data ingestion processes ensures that updates to existing data sources are consistent and accurate.23 In development environments, observability supports conducting regression tests and impact assessments when new code, tools, or configurations are introduced, helping maintain system integrity.23 During large-scale data migration projects, such as transitions to cloud environments, it plays a vital role in verifying data accuracy and ensuring that migrated data matches legacy data in output and functionality.23 By providing visibility into resource utilization, performance trends, and pipeline health, data observability enables data teams to proactively optimize their systems, ensuring smooth data flow and preventing performance degradation. This is crucial for maintaining Service Level Agreements (SLAs) and supporting the increasing demand for real-time data.
4.4. Supporting Data Governance and Regulatory Compliance
In an era of increasing data privacy regulations and stringent compliance requirements, data observability becomes an indispensable tool for demonstrating adherence to policies and mitigating legal and reputational risks. Incorrect or incomplete data can lead to non-compliance with industry regulations, resulting in substantial fines or legal issues.11
Data observability helps organizations in highly regulated industries, such such as finance, healthcare, and telecommunications, ensure that their data meets the necessary standards for accuracy, consistency, and security.1 The lineage pillar is particularly valuable here, as it enables teams to quickly demonstrate where sensitive data resides, how it is processed, and who has accessed or modified it. This transparency is critical for audit readiness and helps in avoiding costly penalties associated with non-compliance.20 With continuous monitoring and auditing capabilities, organizations can quickly identify deviations from established policies, address risks proactively, and ensure ongoing compliance with evolving regulatory requirements.25 Data observability’s ability to provide auditable lineage and monitor data usage patterns offers a level of transparency and control that is difficult to achieve with traditional methods, making it a strategic asset for legal and compliance teams.
4.5. Financial Operations (FinOps) and Cost Optimization
Data observability offers direct and tangible benefits for financial operations (FinOps) and overall cost optimization within the data ecosystem. It provides the necessary visibility to track the costs associated with data storage, processing, and pipeline execution, thereby helping organizations optimize their spending.3
By analyzing data usage patterns and pipeline performance, observability tools can identify expensive datasets or inefficient pipelines, allowing for targeted optimization efforts.3 It helps in better resource planning by offering analytics from data pipelines and processing, enabling teams to provision the right resource amounts and maintain healthy utilization levels.24 Furthermore, data observability helps eliminate redundant data, misconfigurations, and overprovisioning of resources, which are common sources of unnecessary expenditure.24 It can also facilitate the reduction of less-valuable data before it incurs storage or analysis costs.26 By providing real-time monitoring of cloud data operations, enabling cost attribution to specific data sources or jobs, ensuring data quality to prevent reprocessing costs, and offering capabilities for cost prediction and forecasting, data observability directly impacts the bottom line.3 Data observability’s role in FinOps is a testament to its direct business impact. By providing granular visibility into data processing costs and resource utilization, it enables organizations to optimize their cloud spend and avoid unnecessary expenses associated with inefficient data operations. This elevates data management from a pure cost center to a more strategically managed asset.
5. Leading Solutions in the Data Observability Market
The data observability market is experiencing significant growth, driven by the increasing complexity of data environments and the escalating demand for sophisticated monitoring and management tools.4 The “solution” segment, which encompasses integrated software platforms, held a dominant market position, capturing over 64.6% of the data observability market share in 2023.4 This indicates a strong preference for comprehensive, integrated platforms over disparate tools.
A notable trend in the market is the increasing integration of AI and Machine Learning (ML) into observability tools. These technologies are being leveraged to provide predictive insights, automate problem detection, and offer prescriptive actions to prevent potential data issues before they affect the business.4 AI-driven observability platforms are projected to represent a substantial portion of new deployments, with an expected 35% in 2024.4 Furthermore, the increasing adoption of
cloud-based data environments is a key driver for market expansion. By 2025, it is anticipated that 65% of enterprises will deploy data observability tools specifically to monitor and optimize their cloud data infrastructure, reflecting the growing reliance on hybrid and multi-cloud strategies.4 The public cloud segment alone held over 66.5% of the market share in 2023.4 The rapid growth and integration of AI/ML and cloud capabilities within data observability solutions indicate a market maturing quickly to meet the demands of modern data stacks. This suggests that future solutions will be increasingly automated, intelligent, and cloud-native, moving away from manual, on-premise approaches.
5.1. Overview of Commercial Platforms
The commercial data observability landscape features several prominent vendors, each offering unique strengths and capabilities:
- Monte Carlo: Positioned as a pioneer and enterprise leader in data observability, Monte Carlo focuses heavily on data reliability and reducing data downtime. Its core capabilities include automated anomaly detection powered by machine learning, end-to-end pipeline monitoring with automated lineage tracking, and comprehensive enterprise incident management with data quality scoring and root cause analysis. The platform is recognized for its battle-tested reliability at enterprise scale and its comprehensive detection across various data warehouses, data lakes, ETL processes, and Business Intelligence (BI) tools.6
- Acceldata: Acceldata offers an Agentic Data Management Platform that unifies data quality, data governance, and data catalogs. Its key features include AI Agents designed to deeply understand data context, detect anomalies, and take precise corrective actions. The platform promotes real-time collaboration across business and data teams and is powered by a powerful, exabyte-scale, AI-aware data processing engine called xLake Reasoning Engine. Acceldata includes specific AI-powered agents such as the Data Quality Agent (for continuous monitoring and remediation), Data Lineage Agent (for tracking data flow and dependencies), and Data Profiling Agent (for analyzing distributions and structural insights).28 While the provided information does not explicitly detail how Acceldata’s features align with each of the five pillars, its core agents directly contribute to monitoring freshness, distribution, volume, schema, and lineage.
- Sifflet: Sifflet positions itself as an AI-native data observability platform designed to bridge the gap between technical teams and business stakeholders. Its core features include a unified platform that integrates a data catalog, monitoring, and lineage, along with context-rich alerting that utilizes metadata and machine learning to prioritize anomalies and reduce alert fatigue. Sifflet also emphasizes no-code access, enabling business teams to leverage observability insights without deep technical expertise. It is particularly strong in AI-powered automation and fostering business-technical collaboration within modern data stacks.27
- Databand: Databand is described as an AI-powered observability tool specifically designed for complex data pipelines.6 (Note: Detailed features explicitly addressing the five pillars were not extensively available in the provided snippets, as some referenced URLs were inaccessible or lacked direct information 29).
- Dynatrace: A long-standing leader in handling large amounts of data, Dynatrace explicitly defines the five pillars of data observability. Its platform provides capabilities for observing data pipelines and detecting anomalies in data volume, offering comprehensive monitoring for pipeline stability. It supports both Dynatrace-sourced data (from built-in agents) and externally sourced data (from custom ETL processes), with features for anomaly detection and forecasting.12 (Note: Specific features aligning with all five pillars were not explicitly detailed in the provided snippets, as some referenced URLs were inaccessible 30).
- New Relic: New Relic offers an Intelligent Observability Platform that leverages AI-powered insights to provide complete visibility across the technology stack with unlimited scalability. While its core observability pillars are often described as MELT (Metrics, Events, Logs, Traces) 31, its capabilities, such as Log Management, Distributed Tracing, and customizable dashboards, contribute significantly to monitoring data flow and health. It also supports OpenTelemetry for unified data collection.31 (Note: Direct alignment with the five data observability pillars was not explicitly detailed in the provided snippets 32).
- Splunk: Splunk Observability Cloud focuses on data-driven operational intelligence, building on Splunk’s legacy in log management. Its features include robust metrics management, support for histogram metrics to optimize data volume and costs, and integrations that allow users to reuse logs within the observability cloud. Splunk also discusses the five pillars in a general context.7 (Note: Direct alignment with the five data observability pillars was not explicitly detailed in the provided snippets 35).
The commercial market for data observability is characterized by a strong emphasis on automation, AI/ML-driven anomaly detection, and comprehensive end-to-end visibility. Vendors are actively differentiating themselves through the depth of their integrations, their ability to provide crucial business context alongside technical metrics, and their focus on reducing “alert fatigue” for data teams. The varying degrees of explicit alignment with the “five pillars” in vendor descriptions suggest that while these pillars serve as a common industry framework, individual vendors may articulate their product features and benefits differently, often requiring a deeper evaluation of their specific capabilities to understand full alignment.
5.2. Key Open-Source Tools and Frameworks
For organizations with strong in-house engineering capabilities and a preference for customization, several open-source tools and frameworks can be leveraged to build data observability solutions:
- ELK Stack (Elasticsearch, Logstash, Kibana): This popular open-source stack is widely used for log analysis. Elasticsearch serves as a distributed analytics engine for querying and analysis, Logstash acts as a versatile data processing pipeline for ingesting and transforming data from various sources, and Kibana provides powerful data visualization capabilities for interpreting complex information through charts and dashboards.36 It allows for the ingestion, searching, and visualization of vast amounts of log data.37 OpenSearch, a fully open-source solution derived from the ELK stack, offers a community-driven alternative.36
- Prometheus: This is a widely adopted open-source monitoring tool specifically designed for collecting time-series metrics. It excels at scraping metrics from various applications and environments, including modern cloud-native applications and Kubernetes clusters. Prometheus features a flexible query language, PromQL, which allows for powerful data retrieval and manipulation.36
- Grafana: Often paired with Prometheus, Grafana is the leading open-source solution for visualizing observability data. It enables users to create a wide variety of interactive charts and graphs—such as time-series displays, heatmaps, and histograms—to represent metrics, logs, and traces visually. Grafana’s strength lies in its ability to ingest data from multiple sources, providing a comprehensive view of system health and allowing for customized dashboards.36
Open-source tools offer significant flexibility and cost-effectiveness for organizations that possess the necessary in-house engineering expertise to integrate and manage them. However, building a comprehensive data observability solution using disparate open-source components often requires substantial integration effort, ongoing maintenance, and specialized knowledge, which can be a barrier for some organizations. This presents a trade-off between the benefits of customization and cost control versus the ease-of-use, integrated capabilities, and vendor support typically offered by commercial platforms.
Table 3: Overview of Major Data Observability Platforms
| Platform Name | Type | Key Features/Strengths | Noted Limitations (from snippets) |
| Monte Carlo | Commercial | Pioneer in data reliability, automated ML-driven anomaly detection, end-to-end lineage, enterprise incident management.14 | Less advanced AI capabilities vs. newer platforms, limited context-rich alerting/metadata catalog, enterprise pricing may be overkill for smaller teams.27 |
| Acceldata | Commercial | Agentic Data Management, unifies DQ/governance/catalog, AI Agents for context/anomaly/action, xLake Reasoning Engine, Data Quality/Lineage/Profiling Agents.28 | Not explicitly detailed how it addresses the 5 pillars in provided snippets.28 |
| Sifflet | Commercial | AI-native, unifies catalog/monitoring/lineage, context-rich ML alerting, no-code access for business teams, strong for modern data stacks.27 | No deep cost optimization/FinOps, less proven at massive enterprise scale, weaker on complex on-premises deployments.27 |
| Databand | Commercial | AI-powered observability, designed for complex pipelines.6 | Specific features addressing 5 pillars not explicitly detailed in provided snippets.29 |
| Dynatrace | Commercial | Defines 5 pillars, comprehensive pipeline monitoring, anomaly detection for volume, forecasting, supports custom ETL.12 | Specific features aligning with all 5 pillars not explicitly detailed in provided snippets.30 |
| New Relic | Commercial | Intelligent Observability Platform, AI-powered insights, complete stack visibility, unlimited scalability, Log Management, Distributed Tracing, OpenTelemetry support.31 | Direct alignment with 5 data observability pillars not explicitly detailed in provided snippets.32 |
| Splunk | Commercial | Data-driven operational intelligence, strong in log management, metrics management, histogram metrics, log reuse in observability cloud.7 | Direct alignment with 5 data observability pillars not explicitly detailed in provided snippets.35 |
| ELK Stack | Open-Source | Log analysis (Elasticsearch, Logstash, Kibana), distributed analytics, data processing, visualization, flexible.36 | Not officially open source (Elasticsearch/Kibana “open code”), requires significant integration effort.36 |
| Prometheus | Open-Source | Time-series metrics collection, Kubernetes monitoring, flexible PromQL.36 | Does not directly support tracing; requires pairing with other tools for visualization.36 |
| Grafana | Open-Source | Data visualization for metrics/logs/traces, interactive dashboards, multi-source ingestion.36 | Primarily a visualization tool; needs other tools for data collection/management.36 |
6. Real-World Adoption: Companies Employing Data Observability
The adoption of data observability solutions is rapidly expanding across a diverse range of industries, driven by the universal need for reliable data and efficient data operations. Numerous organizations have reported significant benefits and success stories from implementing these platforms.
In the Financial Services sector, where data integrity and real-time insights are paramount due to stringent regulatory requirements and critical reliance on data, data observability has seen dominant adoption.10 A top U.S. Consumer Bank, for instance, leveraged Acceldata to ensure compliant data pipelines, achieve trusted insights, and proactively mitigate risks. This implementation resulted in the recovery of millions in revenue through timely, accurate incentive offers and a remarkable 96% reduction in SLA breaches, significantly improving marketing and decisioning speed.40 Similarly, PhonePe, a hypergrowth payment processor handling over half a billion daily transactions, utilized Acceldata to manage its vast instant payment system, leading to a 46% improvement in data quality and enabling the redirection of data engineers to higher-value tasks.40
The Aviation and Travel industries have also demonstrated strong adoption. Royal Caribbean, a major cruise line, successfully avoided $1 million per hour in potential downtime costs by implementing observability solutions.41 United Airlines significantly improved its operational efficiency by resolving system issues in half the time, contributing to sustained high customer satisfaction.41 In the travel tech space, Kiwi.com transformed its data governance by consolidating thousands of data assets into discoverable data products using Atlan, which, in conjunction with data observability, reduced their central engineering workload by 53% and improved data user satisfaction by 20%.42
In Retail and E-commerce, where data-driven customer experiences and efficient operations are key, data observability has proven invaluable. Rent the Runway, a prominent fashion rental service, achieved a 94% reduction in Mean Time To Resolution (MTTR) for data issues, preventing unplanned downtime and ensuring a stellar customer experience.41 Contentsquare, a digital experience analytics company, relies on Atlan to power its data governance and Business Intelligence efforts, improving data quality communication across stakeholders through its integration with Monte Carlo.42
The Healthcare and Pharmaceutical sectors also benefit significantly, particularly in areas requiring high data accuracy and operational uptime. Regeneron, a leading biotechnology company, reduced instrument downtime by an impressive 800 hours, directly accelerating their ability to create life-changing medicines more efficiently.41
The IT & Telecom segment is experiencing rapid growth in data observability adoption due to its inherent complexities, extensive networks, diverse data streams, and mission-critical systems.10 Vodafone Italia, for example, enhanced user experience by improving the performance of over 30 cloud-based applications through observability.41
Furthermore, Data Providers themselves, whose core business relies on data quality, are prime adopters. A top 3 Data Provider utilized Acceldata to increase data quality coverage across over 1400 daily inputs from 110 countries, resulting in problems being caught and remediated at the source. This led to a remarkable 99% reduction in issue resolution time, decreasing from 14 days to just 4 hours.40
The diverse range of industries and the specific, quantifiable benefits reported (e.g., millions in revenue recovered, 96% SLA reduction, 99% MTTR reduction) demonstrate that data observability is not a niche solution but a cross-industry imperative with tangible Return on Investment (ROI). The consistent focus on reducing downtime, improving data quality, ensuring compliance, and optimizing costs across these varied use cases underscores its universal value proposition and its role in enabling critical business functions.
7. The Risks of Neglecting Data Observability
Failing to implement robust data observability practices in today’s complex data landscape exposes organizations to substantial and multifaceted risks. These risks extend far beyond mere technical inconveniences, impacting core business functions, financial performance, and long-term strategic viability.
7.1. Compromised Data Integrity and Inaccurate Decision-Making
One of the most immediate and profound impacts of poor data observability is the compromise of data quality and integrity. Without adequate monitoring and visibility into data pipelines, organizations are highly susceptible to failing to detect data inconsistencies, inaccuracies, or gaps.11 This leads directly to the use of unreliable information for critical decision-making processes.11 Decisions based on flawed data can result in misguided strategies, missed market opportunities, and ultimately, failed initiatives.11
Furthermore, in an era increasingly reliant on Artificial Intelligence (AI) and Machine Learning (ML), inaccurate data inputs can lead to AI models generating unexpected or incorrect results, severely impacting their performance, reliability, and trustworthiness.3 This risk represents a fundamental erosion of trust in data, which underpins all modern business operations. The problem is not merely about minor errors; it concerns the potential for systemic failures that lead to strategically flawed decisions, directly impacting revenue, customer satisfaction, and competitive positioning. The “ripple effect” of poor data quality means that a single data error can compromise an entire decision-making process, leading to a cascade of negative outcomes.
7.2. Operational Inefficiencies and Lost Productivity
Without effective data observability, data teams are forced into a perpetually reactive mode, spending significant time and resources troubleshooting data issues that could have been prevented or detected much earlier.11 Poor visibility into data pipelines means that errors are often identified too late, causing considerable delays and requiring extensive resources to resolve.11 This leads to increased data downtime, which directly affects business continuity and overall performance.11
The constant need to track down the root cause of data discrepancies can consume hours, days, or even weeks of valuable team time, hindering productivity and diverting skilled personnel from strategic, value-adding tasks.11 For instance, in complex distributed systems, the absence of robust dependency mapping (a key component of lineage) makes it incredibly challenging to trace how various components interact. This lack of visibility can lead to a significantly longer Mean Time to Resolution (MTTR) for incidents, as teams must manually map relationships during incident response instead of relying on automated insights.43 This hidden cost manifests as a significant drag on operational efficiency and a drain on valuable engineering and analyst resources, creating a vicious cycle where teams are constantly firefighting instead of innovating.
7.3. Missed Business Opportunities and Competitive Disadvantage
Data-driven businesses thrive on their ability to rapidly derive accurate insights and act upon them to seize opportunities in real-time. Poor data observability directly impairs this capability, resulting in delayed insights and causing organizations to miss key opportunities for innovation, growth, or market advantage.11
When data is unreliable or delayed, organizations may be too slow to react to emerging market trends, evolving customer needs, or competitive moves, allowing rivals to capitalize on opportunities first.11 This translates directly into lost revenue, as businesses fail to act on valuable data insights that could drive growth.11 The most significant long-term pitfall is the erosion of competitive advantage. In a data-saturated market, the ability to rapidly derive accurate insights and act upon them is paramount. A lack of data observability directly impairs this capability, leading to strategic paralysis and missed market shifts, ultimately impacting market share and growth potential.
7.4. Compliance Failures and Reputational Damage
In an increasingly regulated environment, particularly concerning data privacy (e.g., GDPR), demonstrating data integrity and adherence to policies is critical. Incorrect or incomplete data can lead to severe non-compliance with industry regulations, resulting in substantial fines, legal issues, and costly remediation efforts.11
Furthermore, observability tools, by their nature, collect large amounts of information from multiple systems. If these systems are not properly managed and secured, there is a significant risk of exposing sensitive data or enabling unauthorized access, leading to severe security and privacy breaches.43 Beyond legal and financial penalties, frequent data incidents and a perceived lack of data governance can severely damage customer trust and the organization’s overall reputation.2 Rebuilding trust, once lost, is often a prolonged and challenging endeavor. The legal and reputational ramifications of poor data observability are severe and can have long-lasting consequences beyond financial penalties. A lack of observability not only increases the risk of non-compliance but also undermines stakeholder and customer confidence, which can be difficult to rebuild.
8. Future Trends and Outlook for Data Observability
The landscape of data observability is dynamic and continuously evolving, driven by advancements in technology and the increasing demands of complex data ecosystems. Several key trends are shaping its future trajectory.
8.1. The Rise of AI-Driven Observability and Autonomous Agents
A significant trend is the deepening integration of Artificial Intelligence (AI) and Machine Learning (ML) into observability tools. These technologies are increasingly being leveraged to provide sophisticated predictive insights, automate problem detection, and offer prescriptive actions to prevent potential data issues before they can impact business operations.4 This represents a shift from merely detecting anomalies to anticipating and mitigating them.
Looking ahead, the future will witness an increasingly prominent role for “AI agents”—autonomous software entities—in business operations.25 These intelligent agents will leverage a wealth of business knowledge, including comprehensive observability data and benchmarks, to not only detect anomalies but also to predict potential issues and, crucially, take corrective actions autonomously to prevent disruptions or optimize performance.25 This shift towards AI-driven platforms and autonomous agents signifies a move from human-led analysis to automated detection, prediction, and even remediation. This will exponentially scale data reliability efforts, leading to unprecedented levels of data reliability and operational efficiency. However, it also introduces new challenges around AI governance, explainability, and the imperative for human oversight to ensure ethical and responsible AI use.25 Data observability will become the cornerstone of trust for these AI agent actions, providing a comprehensive audit trail of their decisions, the underlying data they utilize, and the rationale behind their actions.25 This fosters a hybrid approach where humans and AI work in tandem, leveraging their respective strengths for optimal outcomes.
8.2. Deeper Integration with DataOps and DataSecOps
Data observability is increasingly becoming a fundamental component of broader data management frameworks such as DataOps and DataSecOps. It is recognized as the “natural evolution of the data quality movement,” which is precisely what makes the practice of DataOps possible.1 This signifies a holistic approach to data lifecycle management, where data quality, security, and operational efficiency are not siloed concerns but are continuously monitored and optimized as part of an integrated, automated pipeline.
The growing integration of observability with DevOps practices is fostering a culture of collaboration, transparency, and continuous improvement across the entire software development lifecycle.25 Furthermore, there is an escalating focus on security, governance, risk, and compliance as a primary driver for the adoption of observability.31 Data observability complements existing policy adherence procedures by offering critical visibility into data usage, AI model behavior, and potential risks.25 This enables organizations to quickly identify deviations from policies, address risks proactively, and ensure compliance with evolving regulatory requirements.25 This convergence reflects the growing recognition that data health is inextricably linked to overall system health and security, making data observability a crucial glue that binds various data disciplines together, enabling more robust and secure data ecosystems.
8.3. Addressing Complexity in Cloud and Distributed Environments
The relentless shift towards cloud-based and highly distributed data architectures continues to accelerate the demand for comprehensive data observability tools. These modern environments necessitate solutions that can provide seamless visibility across diverse and often disparate data landscapes.10 Organizations are increasingly relying on hybrid and multi-cloud strategies, which inherently introduce greater complexity and fragmentation, further driving the need for advanced observability solutions.4
The advent of serverless architectures and edge computing presents new and unique challenges for data observability. In these highly distributed paradigms, traditional monitoring approaches often fall short, struggling to provide the necessary end-to-end visibility and context.25 Data observability platforms must adapt to handle these distributed systems effectively, ensuring that engineers can accurately track data flows, pinpoint performance issues, and maintain system reliability regardless of where the data resides or how it is processed.25 Scaling observability for big data environments also remains a significant challenge that future solutions will continue to address.5 The increasing complexity and fragmentation of modern data architectures make traditional monitoring obsolete. Data observability is uniquely positioned to provide the necessary end-to-end visibility and context across these fragmented landscapes, ensuring data integrity and performance regardless of where the data resides or how it’s processed. This is a critical enabler for ongoing digital transformation initiatives.
Conclusion: The Path to Data Trust and Business Agility
Data observability has unequivocally emerged as a critical and indispensable practice for any organization navigating the complexities of the modern data landscape. It represents a fundamental shift from reactive problem identification to proactive understanding, prediction, and systemic resolution of data issues. By providing a holistic, real-time understanding of data health across its entire lifecycle, data observability ensures the quality, reliability, and availability of data—the lifeblood of today’s digital economy.
The five pillars—Freshness, Distribution, Volume, Schema, and Lineage—collectively form a robust framework that enables organizations to meticulously monitor and manage every critical aspect of their data. This comprehensive approach differentiates data observability from traditional data quality, as it focuses on the operational health of the entire data delivery system, addressing root causes rather than just symptoms. This distinction is crucial, as data observability extends and enhances data quality, creating a powerful synergy that builds and sustains data trustworthiness.
The practical applications of data observability are far-reaching, from ensuring the reliability and performance of AI/ML models and accelerating root cause analysis, to optimizing data pipelines and supporting stringent data governance and compliance requirements. Its direct impact on financial operations, by enabling cost optimization and efficient resource planning, further underscores its tangible business value. The rapid growth of the data observability market, driven by the increasing complexity of data, the pervasive adoption of AI, and the shift to cloud environments, reflects a widespread recognition of its strategic imperative across diverse industries.
Conversely, neglecting data observability exposes organizations to severe consequences. These include compromised data integrity leading to inaccurate decision-making, significant operational inefficiencies and lost productivity, missed business opportunities that erode competitive advantage, and severe compliance failures that can result in substantial financial penalties and irreparable reputational damage.
Looking ahead, the future of data observability is characterized by increasing intelligence and autonomy, with AI-driven platforms and autonomous agents poised to revolutionize how data issues are detected, predicted, and even remediated. Furthermore, its deeper integration into broader data management frameworks like DataOps and DataSecOps will solidify its role as a foundational element for secure, compliant, and agile data operations. The ongoing evolution of cloud and distributed computing environments will continue to underscore the necessity for comprehensive, end-to-end data observability solutions capable of providing clarity across fragmented landscapes.
In conclusion, data observability is no longer a mere operational enhancement; it is a strategic investment that is foundational for any organization aspiring to be truly data-driven and competitive in the digital age. By embracing and maturing their data observability capabilities, organizations can build unwavering trust in their data, unlock its full potential, and achieve the agility required to thrive in an increasingly complex and data-dependent world.
References
- 1
https://www.ibm.com/think/topics/data-observability - 2
https://www.siffletdata.com/blog/data-observability - 8
https://www.siffletdata.com/blog/data-observability-five-years-in-why-the-old-playbook-doesnt-work-anymore - 9
https://www.observo.ai/post/evolution-observability-logs-to-ai-driven-analytics - 3
https://www.dqlabs.ai/blog/why-data-observability-matters-for-ai-readiness/ - 4
https://market.us/report/data-observability-market/ - 10
https://www.grandviewresearch.com/industry-analysis/data-observability-market-report - 12
https://docs.dynatrace.com/docs/analyze-explore-automate/data-observability - 13
https://medium.com/data-science/introducing-the-five-pillars-of-data-observability-e73734b263d5 - 36
https://www.groundcover.com/blog/observability-tools - 23
https://datakitchen.io/the-five-use-cases-in-data-observability-part-3/ - 24
https://www.acceldata.io/article/top-ten-use-cases-for-data-observability - 21
https://atlan.com/data-quality-and-observability/ - 19
https://firsteigen.com/blog/differences-between-data-quality-and-data-observability/ - 11
https://sixthsense.rakuten.com/data-observability/blog/The-Hidden-Cost-of-Poor-Data-Observability - 43
https://www.motadata.com/blog/common-pitfalls-to-avoid-in-observability-practices/ - 25
https://www.pwc.com.au/digitalpulse/the-future-of-data-observability.html - 5
https://dagster.io/guides/data-governance/data-observability-in-2025-pillars-pros-cons-best-practices - 16
https://atlan.com/data-observability-101/ - 14
https://www.datacamp.com/blog/data-observability - 15
https://www.upsolver.com/blog/the-5-pillars-of-data-observability - 1
https://www.ibm.com/think/topics/data-observability - 6
https://uptrace.dev/glossary/what-is-data-observability - 31
https://newrelic.com/blog/best-practices/what-is-observability - 32
https://newrelic.com/platform - 13
https://medium.com/data-science/introducing-the-five-pillars-of-data-observability-e73734b263d5 - 33
https://www.splunk.com/en_us/blog/devops/the-five-tenets-of-observability.html - 37
https://aws.amazon.com/what-is/elk-stack/ - 38
https://www.elastic.co/elastic-stack/features - 39
https://www.tigera.io/learn/guides/prometheus-monitoring/prometheus-grafana/ - 26
https://cribl.io/observability/ - 24
https://www.acceldata.io/article/top-ten-use-cases-for-data-observability - 41
https://www.splunk.com/en_us/customers/success-stories/observability.html - 40
https://www.acceldata.io/case-studies - 27
https://www.siffletdata.com/blog/best-data-observability-tools - 14
https://www.datacamp.com/blog/data-observability - 15
https://www.upsolver.com/blog/the-5-pillars-of-data-observability - 12
https://docs.dynatrace.com/docs/analyze-explore-automate/data-observability - 22
https://www.xenonstack.com/blog/pillars-of-data-observability - 20
https://www.siffletdata.com/blog/data-lineage - 42
https://atlan.com/what-is-a-data-catalog/ - 31
https://newrelic.com/blog/best-practices/what-is-observability - 32
https://newrelic.com/platform - 34
https://www.splunk.com/en_us/blog/observability/observability-data-management-efficient-tips.html - 7
https://www.splunk.com/en_us/blog/learn/data-observability.html - 17
https://www.siffletdata.com/insights/data-observability-101 - 2
https://www.siffletdata.com/blog/data-observability - 18
https://www.bigeye.com/blog/the-four-pillars-of-data-observability - 44
https://www.getorchestra.io/guides/what-are-the-five-pillars-of-monitoring-and-observability
Works cited
- What is Data Observability? – IBM, accessed August 1, 2025, https://www.ibm.com/think/topics/data-observability
- What Is Data Observability? A Complete Guide for Data Teams – Sifflet, accessed August 1, 2025, https://www.siffletdata.com/blog/data-observability
- What is Data Observability? Why it Matters for AI Readiness? – DQLabs, accessed August 1, 2025, https://www.dqlabs.ai/blog/why-data-observability-matters-for-ai-readiness/
- Data Observability Market Size, Share | CAGR at 11.8%, accessed August 1, 2025, https://market.us/report/data-observability-market/
- Data Observability in 2025: Pillars, Pros/Cons & Best Practices – Dagster, accessed August 1, 2025, https://dagster.io/guides/data-governance/data-observability-in-2025-pillars-pros-cons-best-practices
- What is Data Observability? The Complete Guide for 2025 – Uptrace, accessed August 1, 2025, https://uptrace.dev/glossary/what-is-data-observability
- Data Observability: The Complete Introduction – Splunk, accessed August 1, 2025, https://www.splunk.com/en_us/blog/learn/data-observability.html
- Data Observability, Five Years In: Why the Old Playbook Doesn’t Work Anymore – Sifflet, accessed August 1, 2025, https://www.siffletdata.com/blog/data-observability-five-years-in-why-the-old-playbook-doesnt-work-anymore
- Observability 101: The Evolution of Observability: From Log Management to AI-Driven Analytics – Observo AI, accessed August 1, 2025, https://www.observo.ai/post/evolution-observability-logs-to-ai-driven-analytics
- Data Observability Market Size, Share & Growth Report 2030 – Grand View Research, accessed August 1, 2025, https://www.grandviewresearch.com/industry-analysis/data-observability-market-report
- The Hidden Cost of Poor Data Observability – Rakuten SixthSense, accessed August 1, 2025, https://sixthsense.rakuten.com/data-observability/blog/The-Hidden-Cost-of-Poor-Data-Observability
- Data Observability — Dynatrace Docs, accessed August 1, 2025, https://docs.dynatrace.com/docs/analyze-explore-automate/data-observability
- Introducing the 5 Pillars of Data Observability | by Barr Moses | TDS Archive – Medium, accessed August 1, 2025, https://medium.com/data-science/introducing-the-five-pillars-of-data-observability-e73734b263d5
- Data Observability Explained: Concepts, Tools & Best Practices – DataCamp, accessed August 1, 2025, https://www.datacamp.com/blog/data-observability
- The 5 Pillars of Data Observability – Upsolver, accessed August 1, 2025, https://www.upsolver.com/blog/the-5-pillars-of-data-observability
- Data Observability: Definition, Key Elements, & Benefits – Atlan, accessed August 1, 2025, https://atlan.com/data-observability-101/
- Your Essential Guide to Getting Started with Data Observability – Sifflet, accessed August 1, 2025, https://www.siffletdata.com/insights/data-observability-101
- The Four Pillars of Data Observability – Bigeye, accessed August 1, 2025, https://www.bigeye.com/blog/the-four-pillars-of-data-observability
- Understand the Difference Between Data Observability vs Data Quality – FirstEigen, accessed August 1, 2025, https://firsteigen.com/blog/differences-between-data-quality-and-data-observability/
- How Data Lineage Works and Why It Matters – Sifflet, accessed August 1, 2025, https://www.siffletdata.com/blog/data-lineage
- Data Quality and Observability: Key Differences & Relationships! – Atlan, accessed August 1, 2025, https://atlan.com/data-quality-and-observability/
- Data Observability in Data Streaming: 5 Key Pillars – XenonStack, accessed August 1, 2025, https://www.xenonstack.com/blog/pillars-of-data-observability
- The Five Use Cases in Data Observability: Mastering Data Production | DataKitchen, accessed August 1, 2025, https://datakitchen.io/the-five-use-cases-in-data-observability-part-3/
- Data Observability: Top 10 Use Cases – Acceldata, accessed August 1, 2025, https://www.acceldata.io/article/top-ten-use-cases-for-data-observability
- The future of data observability: Trends and innovations – PwC Australia, accessed August 1, 2025, https://www.pwc.com.au/digitalpulse/the-future-of-data-observability.html
- Observability Use Cases: Solving Real-World IT Challenges – Cribl, accessed August 1, 2025, https://cribl.io/observability/
- 7 Best Data Observability Tools in 2025 | Compare Sifflet, Monte Carlo & More, accessed August 1, 2025, https://www.siffletdata.com/blog/best-data-observability-tools
- Acceldata | Agentic Data Management Platform | Enterprise Data …, accessed August 1, 2025, https://www.acceldata.io/
- accessed December 31, 1969, https://www.databand.ai/
- accessed December 31, 1969, https://www.dynatrace.com/platform/data-observability/
- What is Observability: Benefits & Use Cases | New Relic, accessed August 1, 2025, https://newrelic.com/blog/best-practices/what-is-observability
- Intelligent Observability Platform – New Relic, accessed August 1, 2025, https://newrelic.com/platform
- The Five Tenets of Observability – Splunk, accessed August 1, 2025, https://www.splunk.com/en_us/blog/devops/the-five-tenets-of-observability.html
- Observability Costs: Tips for More Efficient Data Management | Splunk, accessed August 1, 2025, https://www.splunk.com/en_us/blog/observability/observability-data-management-efficient-tips.html
- accessed December 31, 1969, https://www.splunk.com/en_us/data-observability.html
- Top 8 Observability Tools for 2025: Go from Data to Action – groundcover, accessed August 1, 2025, https://www.groundcover.com/blog/observability-tools
- What is the ELK stack? – Elasticsearch, Logstash, Kibana Stack Explained – AWS, accessed August 1, 2025, https://aws.amazon.com/what-is/elk-stack/
- Elastic (ELK) Stack features list, accessed August 1, 2025, https://www.elastic.co/elastic-stack/features
- Prometheus with Grafana: 5 Compelling Use Cases – Tigera.io, accessed August 1, 2025, https://www.tigera.io/learn/guides/prometheus-monitoring/prometheus-grafana/
- Case Studies – Success Stories in Data Observability – Acceldata, accessed August 1, 2025, https://www.acceldata.io/case-studies
- Observability Success Stories – Splunk, accessed August 1, 2025, https://www.splunk.com/en_us/customers/success-stories/observability.html
- What Is a Data Catalog? Features, Benefits & 2025 Essentials – Atlan, accessed August 1, 2025, https://atlan.com/what-is-a-data-catalog/
- Common Pitfalls to Avoid in Observability Practices – Motadata, accessed August 1, 2025, https://www.motadata.com/blog/common-pitfalls-to-avoid-in-observability-practices/
- What Are the Five Pillars of Monitoring and Observability? – Orchestra, accessed August 1, 2025, https://www.getorchestra.io/guides/what-are-the-five-pillars-of-monitoring-and-observability